Posted on: 24 May 2023
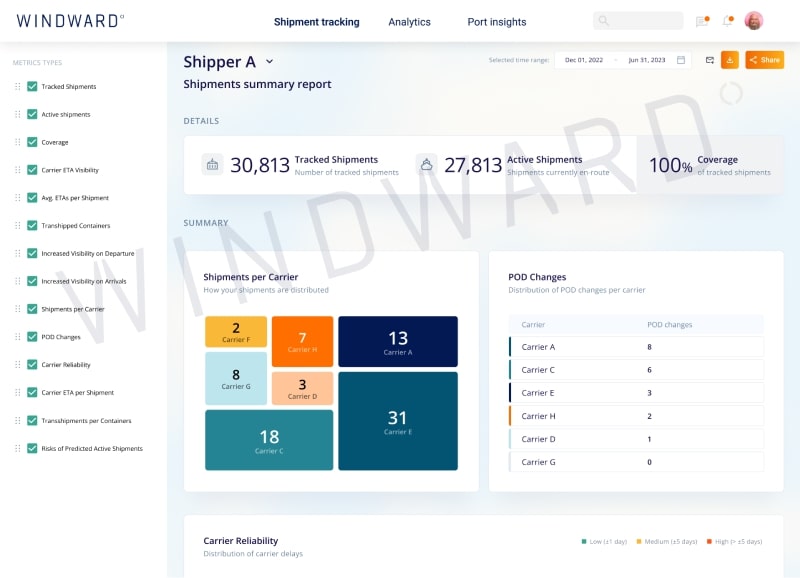
Windward (LSE: WNWD), the leading Maritime AI™ company, announced today the launch of its Shipment Analytics Dashboard. The new dashboard, now available as part of Windward’s Ocean Freight Visibility (OFV) solution, showcases statistics and analytics about customer shipment and carrier performance to provide them with a holistic assessment of past and current shipments, with additional insights creating a feedback loop between shipment execution and freight procurement to help improve and optimize business decisions.
Lack of data and visibility is a large contributor to supply chain challenges and delays, not only between entities but also within individual organizations, causing reduced efficiency, increased operational costs, inaccurate forecasting, and poor customer experience.
Windward’s Shipment Analytics Dashboard provides businesses with individualized analytics on past and current shipments including Port of Discharge (POD), changes per carrier, carrier delays, ETA changes, number of transshipped containers, and active shipments at risk of delay.
Windward’s unique data sets and Maritime AI insights are constantly being used by customers who build their own dashboards using Windward’s API Insight lab. The insights are integrated directly into customer workflows via API to support business decisions across departments ranging from procurement, operations, negotiations, inventory management, customer success, and more. Windward’s Maritime AI insights, powered by billions of data points and advanced behavioral models enable better business processes, thus increasing efficiency and ROI.
“Data is a vital element of any decision-making process, but when implemented directly into the various workflows across departments, it has the power to drastically improve efficiency and processes for the entire organization,” said Ami Daniel, CEO and Co-Founder of Windward. “Windward’s mission is to empower supply chain stakeholders to make informed decisions in order to increase efficiency and decrease costs of their shipping operations. Our new Shipping Analytics Dashboard is a valuable tool that allows them to easily deep dive into their own data and accomplish their goals.
Windward’s Shipment Analytic Dashboard is an added capability to the company’s Ocean Freight Visibility (OFV) solution which utilizes data aggregated from more than 120 carriers, 1,400+ ports and terminals, 5,500 container vessels, sailing schedules, meteorological data, and location and AIS data. The solution provides accurate ETA predictions and real-time visibility into container and vessel journeys allowing users to better predict, plan, and proactively mitigate supply chain risks.


